Background
Uprising Food Inc. is on a mission to bring Keto-friendly bread to the masses. They teamed up with a local Cincinnati bread icon in order to make a Ketogenic-approved bread that above all, tastes great. The website was launched in March of 2019 and has been a great success.
The Problem
Uprising Foods Inc. wanted to provide a helpful tool for the “Keto Switcher.” The goals of this tool are to provide value for the customer, gain leads for their Shopify store, and build loyalty among their current customers.
The Solution
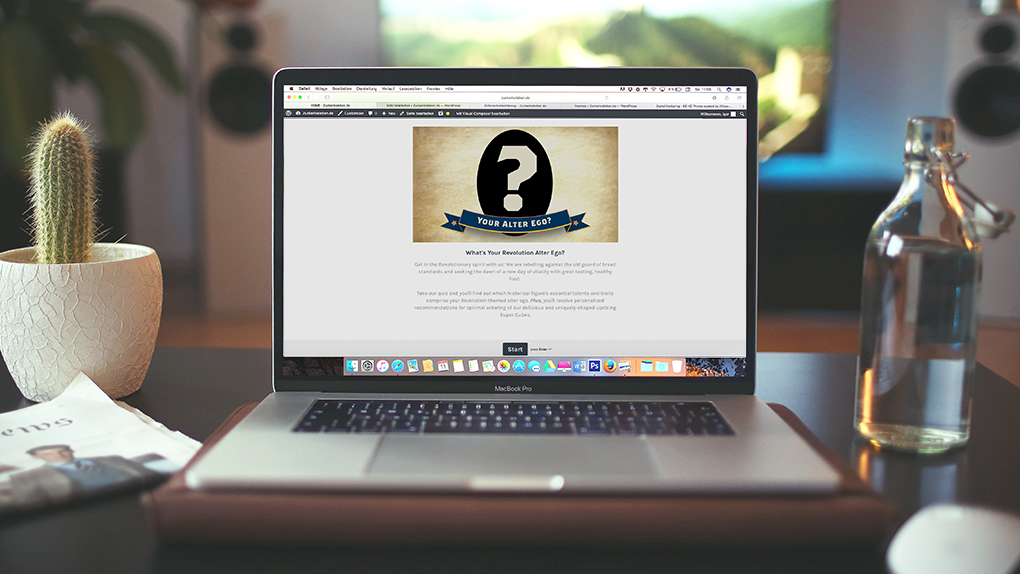
The solution was to create a calculator to determine how much Keto bread the user should be consuming. In order to keep costs down, we developed the tool in Typeform while matching Uprising’s style and branding guidelines.
- My Role: Research, Stakeholder Interview, User Interviews, Sketches, Wireframes, Design, and User Testing.
- Tools: Usertesting.com, NVivo Transcription, Sketch, Typeform, and Shopify.
Design Process
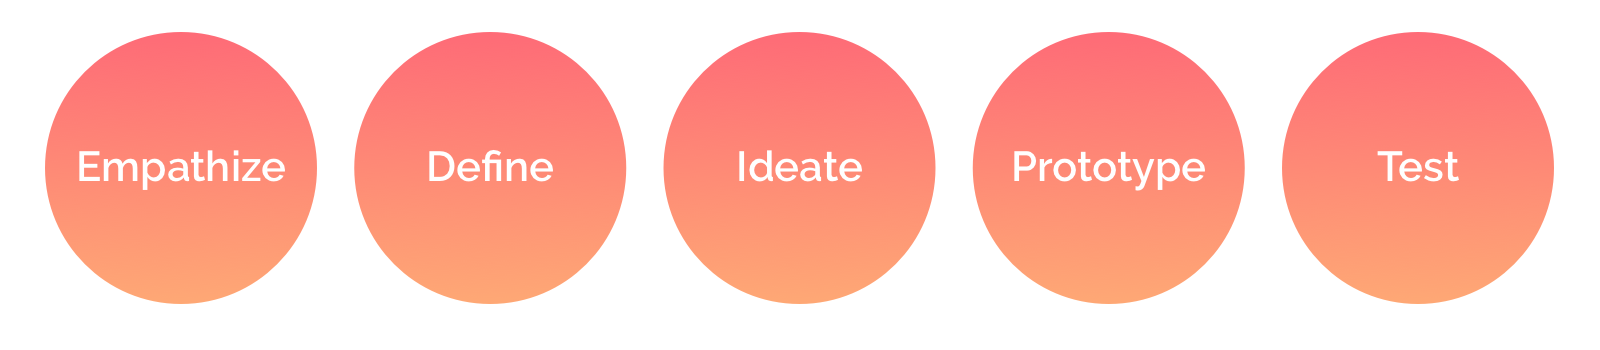
Empathize
Research
Stakeholder Interview
As part of the Uprising Calculator Tool Project we held a kickoff meeting. The purpose of this meeting was to get to know Uprising, their target marketing, and make sure everyone was on the same page for the project. My key findings included:
-
Company Goals - Uprising hopes to discover things Keto Switchers are experiencing and prioritize the things they are solving around those opportunities.
-
Target Market - Uprising’s target market is the Keto Switcher, or someone new to Keto or eating low-carb.
-
Competition - Uprising competes on taste first, Keto second. Most of the competition does the opposite. Uprising wants to be the best tasting, full stop. Now let's look at how this is the best for the Keto lifestyle.
-
Project Goals - To understand the hero buyer and create a tool that’s meaningful and useful to the user.
User Survey
Next I created a user survey in order to gather more data on the user. This survey was sent to current customers, potential customers, and posted across social media channels. We targeted people who were currently living a Keto lifestyle, or had in the past. My key findings from over 100 participants:
-
40% of participants heard about Keto through a friend. 35% heard about Keto online.
-
Once participants discovered Keto, they sought more info online from pod casts, blogs, Facebook, and YouTube.
-
99% of participants had tried other diets or nutritional guides before.
-
The top 3 reasons people were doing Keto were to lose weight, help with specific health issues, and gain better physical and mental health.
-
The biggest hurdles people faced when it comes to Keto were integrating the food with their family’s lifestyle and giving up some foods like bread and sugar.
User Interviews
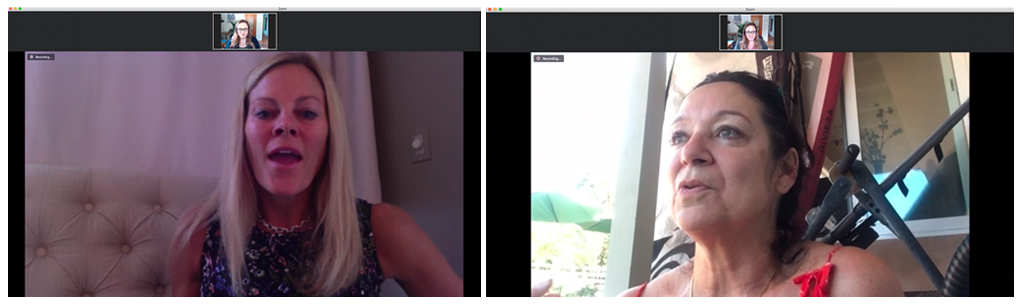
Using the data from the user survey, I recruited three participants that fit into the target market and majority demographic we were looking for. This helped to dig a little deeper into some of the issues Keto switchers face. The two key takeaways were:
-
Keto switchers are busy
-
Keto switchers struggled to make Keto family-friendly
Existing Data - Facebook, Website
Since the website and Facebook page had been up-and-running for some time, I was able to leverage some of the user data from those sources as well. This data was used to build personas and pain points.
Define
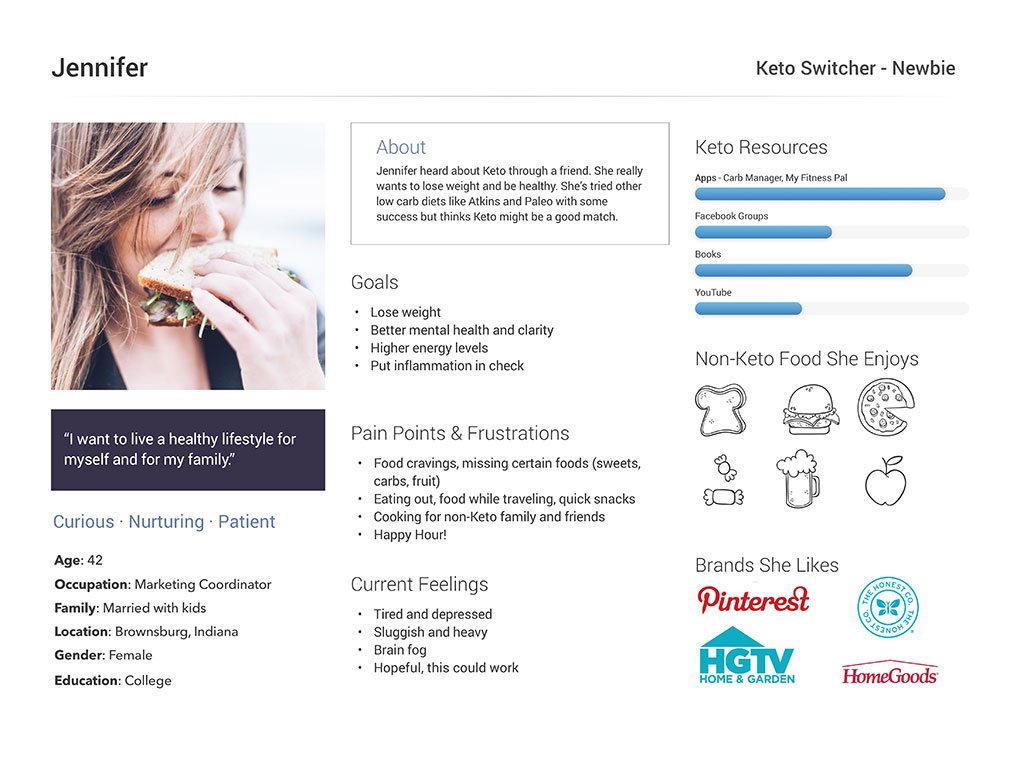
Persona
Based on the research, I created two user personas. The first being the “Keto Switcher” and the client’s target market. The second, “Keto Expert,” was a majority of the client's existing customers.

User Journey
Next, I created a user journey to dig deeper into the user’s process of starting a Keto lifestyle. This helped me to understand some of the user’s most common pain points and ultimately what the best solution would be.
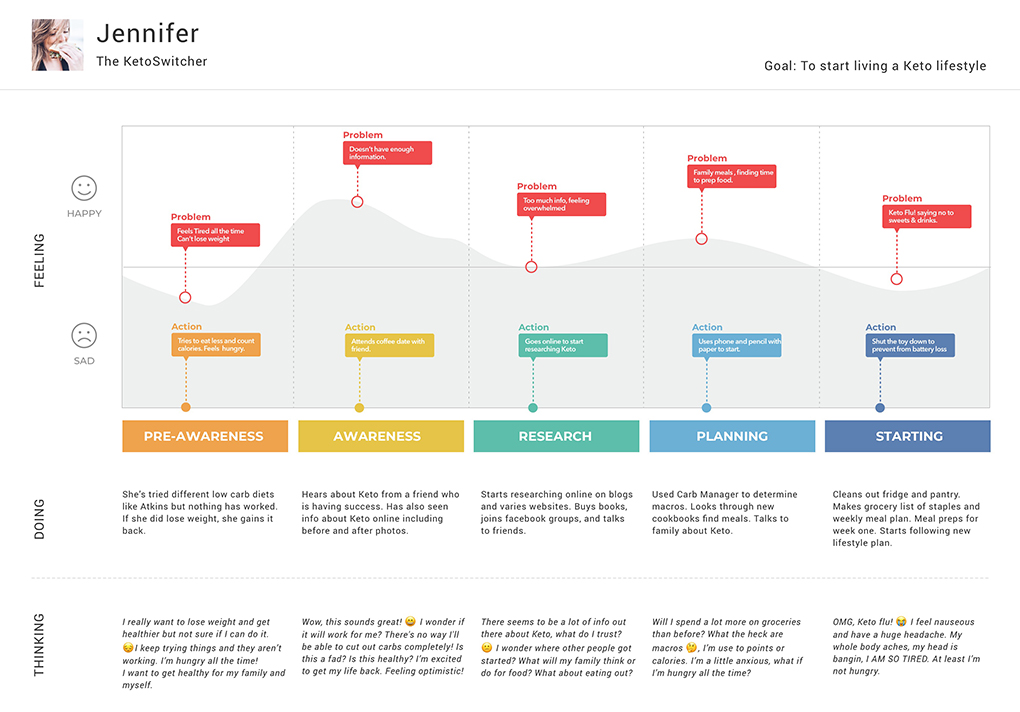
Pain Points
-
Food cravings, missing certain foods like carbs, sweets, and fruit.
-
Food on-the-go including eating out, food while traveling, and quick snacks.
-
Preparing delicious food for non-Keto family and friends.
Ideate
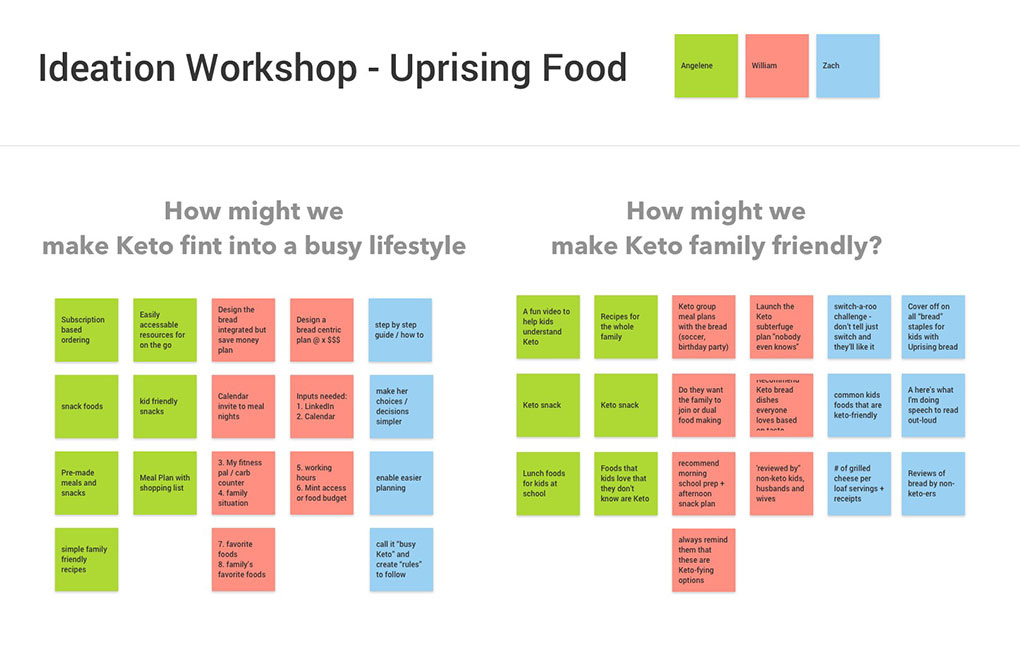
Ideation Workshop
With all of our research at hand, I arranged for an ideation workshop with the client. We created and answered “how might we” questions in order to brainstorm solutions that best fit the user. Two of the main questions we focused on were:
- How might we help Keto fit into a busy lifestyle?
- How might we make Keto more family friendly?
Solution
Based on our workshop, the solution was to create a tool that focused on the whole family, not just the “Keto Switcher.” This would help the user and their family enjoy some of their favorite bread-based meals that they have been missing. This tool would help the user understand how much bread to order and how often, as well as include easy recipes based on the user’s feedback and preferences.
Prototype
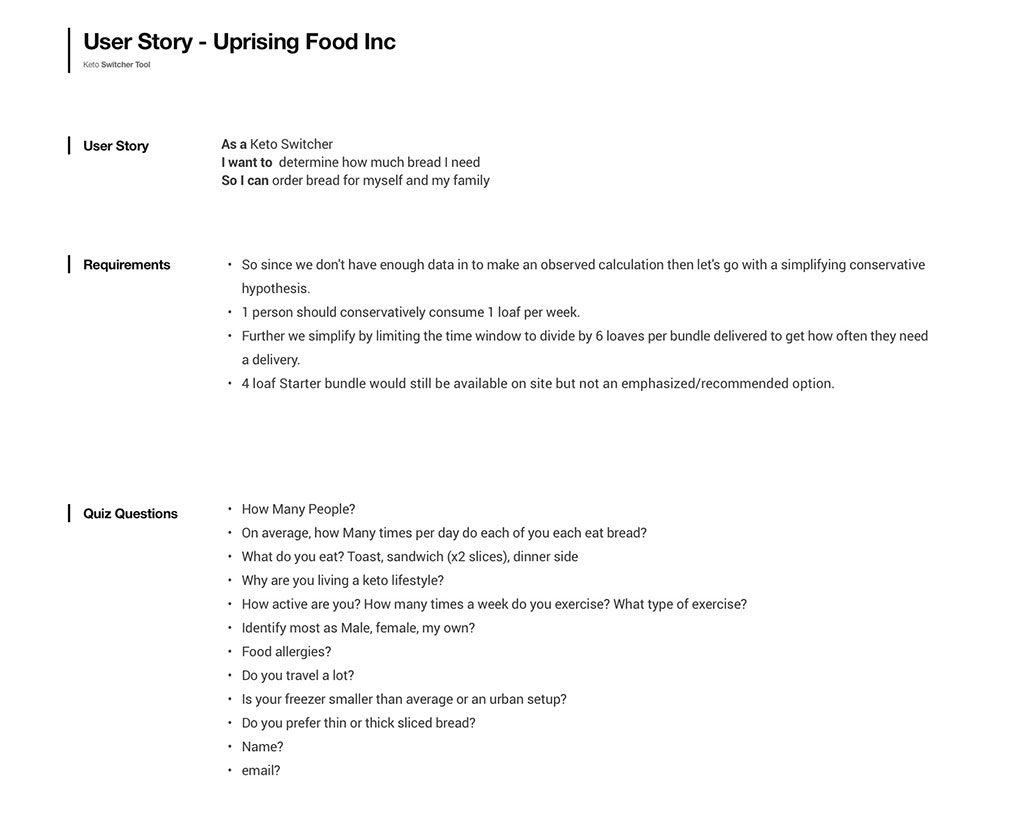
User Story
In order to articulate how this tool will provide value to the user, I created a user story. I also included requirements in this document.
Functional Prototype
Before diving into Typeform, I utilized a spreadsheet to create a prototype of the calculations that would be needed. We did internal testing to ensure accurate calculations.
Visual Design
Because I was using Typeform, I took the spreadsheet calculations, utilized a system template with a generic look in order to start testing quickly. Later, I customized the design to match the Uprising branding.
Test
User Testing
We used usertesting.com in order to conduct an unmoderated test. We recruited three participants via usertesting.com’s platform. These participants fit the Keto Switcher persona: 35-50 year old females in the United States.
Test Objectives
- Do users find value in taking the quiz?
- Do users understand how to navigate the quiz?
- Do users think the quiz is the correct length?
- Are there any questions that users find confusing?
- Are users comfortable with answering all questions in the quiz?
Testing Results
- Users found the quiz fun and valuable.
Upon completion of the quiz, users were delighted with the results and found them to be useful in knowing how much bread to order. - Users navigated through the quiz with ease.
All participants had zero problems navigating through the quiz. The multiple selection options caused some hesitation but it was only momentarily and the users didn’t indicate that they noticed their own hesitation. - Users thought the quiz was an appropriate length.
One user described the length as being “just right, not too long or too short” and another said that the quiz length was “not bad at all”. - Some questions were a little confusing to users.
There were a few questions that users found to be a little confusing. I believe these issues can be addressed easily with slight copy or format changes. - Users expressed concern about answering two of the questions.
There were two questions where users thought they might not want to answer. They didn’t think it was “too big of a deal” but could see some users taking offense or not wanting to give personal information.
Iterate
I addressed the confusing questions with some slight copy or format changes. The questions that users had concerns about were business requirements and were not removed.
Conclusion
Solution
In the end, we created a tool that is useful to the user and the client was able to better understand their users.
Challenges
One challenge I ran into was curating artwork for the quiz results. We had originally planned on having custom artwork for each quiz result. Due to budget constraints, I came up with an alternative utilizing free stock images customized to match Uprising’s branding.
The second issue I ran into was that Typeform wouldn’t allow for us to send customized email results to the users. Unfortunately, we didn’t find a solution for this at the time but there were a few solutions that the client may implement in the future.
Reflections
Despite going past the original deadline, we were able to stay on budget with the final product. If budget was unlimited, I would have liked to address some of the issues with Typeform.
After a month of being live, the quiz had a 25% completion rate. As predicted, the largest abandonment rate occurred when users were asked for their email address.
Acknowledgments
During this project I worked closely with the company stakeholders who were key to knowing the company and its goals. A very special thanks to Lindsay Neibauer for writing most of the copy and playing a vital role in internal testing.